Library of Clarity · UX & Conversion
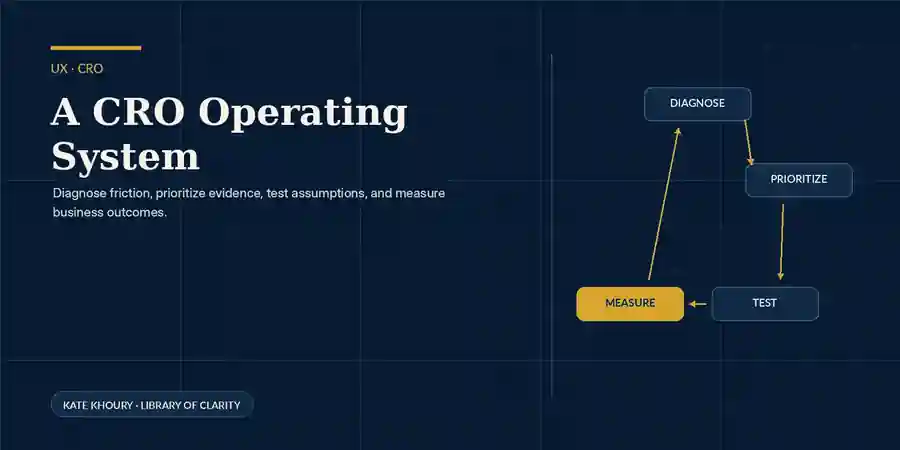
Conversion optimization is an operating loop, not a collection of website tactics.
The strongest CRO programs connect quantitative data, qualitative behavior, business priorities, UX design, experimentation and implementation into a repeatable system for finding and removing friction.
1. Diagnose the actual constraint.
Start by identifying where the journey is underperforming and what evidence supports that conclusion. I combine multiple signals because no single tool explains user behavior on its own.
Quantitative
GA4/GTM events, funnel conversion, product views, add-to-cart, checkout, source performance, bounce/exit, device and page-level trends.
Behavioral
Heatmaps, scroll depth, session replay, rage clicks, repeated navigation, search behavior and other indicators of friction or confusion.
Qualitative
User feedback, support questions, usability testing, stakeholder observations and content comprehension.

2. Prioritize by evidence and business impact.
A long backlog is not a strategy. I score opportunities using a combination of expected impact, evidence strength, implementation effort, audience reach and business priority.
| Question | Why it matters |
|---|---|
| How large is the affected audience? | A severe issue on a low-traffic page may matter less than moderate friction in the primary path. |
| How close is the issue to revenue or activation? | Checkout, trial activation, lead capture and first-value moments usually deserve higher urgency. |
| How strong is the evidence? | Multiple signals reduce the risk of optimizing based on noise or preference. |
| How difficult is the change? | Quick wins can fund learning while larger changes move through design and development. |
3. Test the assumption—not just the design.
Every experiment should state the expected behavior change and the business reason behind it – the hypothesis. The treatment can be a layout, message, offer, flow, timing or personalization change; the hypothesis is the mechanism we believe will improve the outcome.
Example hypothesis: If we remove unnecessary checkout steps and show a relevant location-based upsell after the purchase decision, more buyers will complete checkout and increase the average revenue per user (ARPU).
To read more about choosing between controlled A/B testing and adaptive optimization, see Experimentation Strategy: A/B Testing vs. Multi-Armed Bandits.
4. Measure the whole system, not only the winning variation.
A local conversion win can create a downstream problem if not viewed comprehensively. I track the primary outcome alongside guardrails and secondary metrics, or signals, that may include lead quality, AOV/ARPU, revenue, retention, support volume, page performance, and funnel progression.
+35%
Conversions and revenue within three months after streamlining an email-to-checkout journey.
+40%
ARPU from a location-based personalized upsell in the same purchase experience.
+58%
Add-to-cart rate from updated product-page design, content and journey improvements.
+44%
Qualified organic traffic through on-page and technical SEO improvements.
The loop is the operating model.
Diagnose → prioritize → design → test → measure → document → repeat.
I like to build design and testing roadmaps, conducting ongoing tests based on a plan with hypotheses and clear data. The result is that, over time, the organization builds a reusable body of evidence instead of starting every web project from scratch.