
By distributing credit across multiple touchpoints, multi-touch attribution models help marketers optimize budget allocation, refine messaging, and improve overall campaign performance.
In today’s data-driven marketing landscape, understanding which touchpoints drive conversions is more critical than ever. Traditional attribution models fail to capture the complexity of modern customer journeys. Enter multi-touch attribution (MTA): a model designed to provide a holistic view of how different marketing channels and interactions contribute to revenue.
Attribution Models – Quick Guide
In the following paragraphs, we’ll explore the way I’ve approached building multi-touch attribution models, using the steps below:
- Define the customer journey, mapping every twist, turn, and challenge along the path.
- Track conversion events to capture moments of truth and decision.
- Employ heatmaps and session recordings to uncover hidden obstacles and opportunities for engagement.
- Segment your audience for tailored treasures that resonate with each unique visitor.
- Visualize data with funnel analysis tools, turning insights into actions that lead to untold wealth in conversions.
When building a multi-touch attribution model, these three essential features need to be considered:

Instead of assigning full credit to a single touchpoint, an MTA model distributes credit across multiple interactions.

MTA should track interactions across multiple marketing channels (email, paid search, organic search, webinars, social media) and attribute them to conversions.

Understanding the most common sequences of interactions that lead to conversions helps refine marketing strategies.
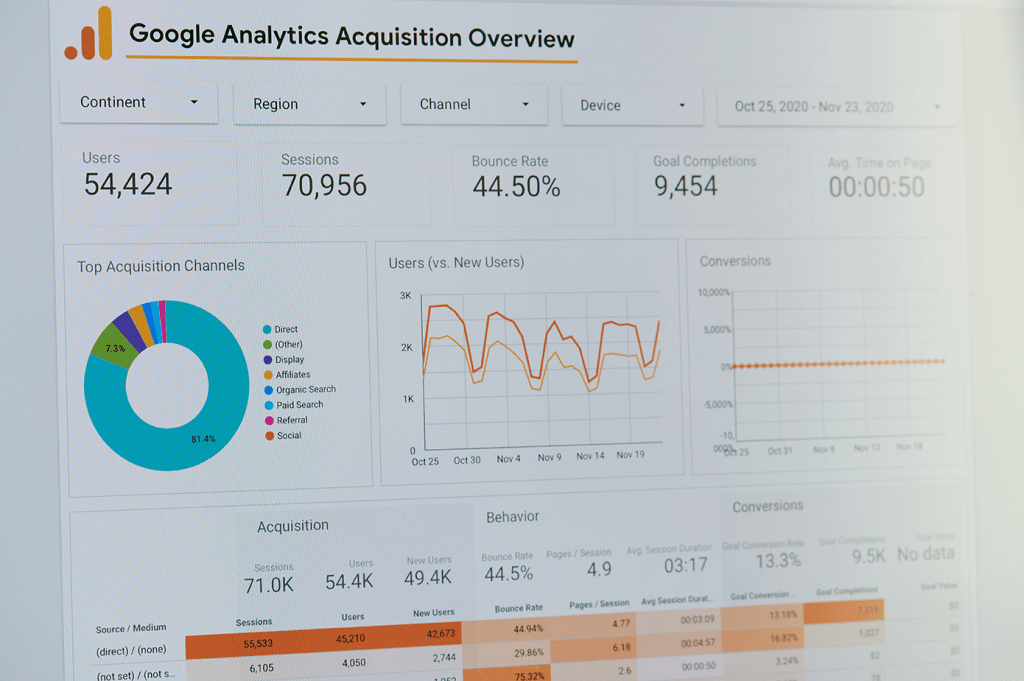
Multi-Touch Attribution Overview
Developing multi-touch attribution models is key to understanding marketing performance and user behavior. By capturing all the touchpoints along the funnel, scoring each based on a numeric system based on top, middle, or bottom of funnel position, and building in a time decay that aligns with the buyer lifecycle, allows for a full, 360-degree view of customer/prospect behavior and accurate attribution modeling.
These data points can then be translated into accurate data analysis and dashboards, predictive analytics, providing insight into proper resource allocation and campaign/channel performance, uncovering upsell and cross-sell opportunities, retargeting, and more.
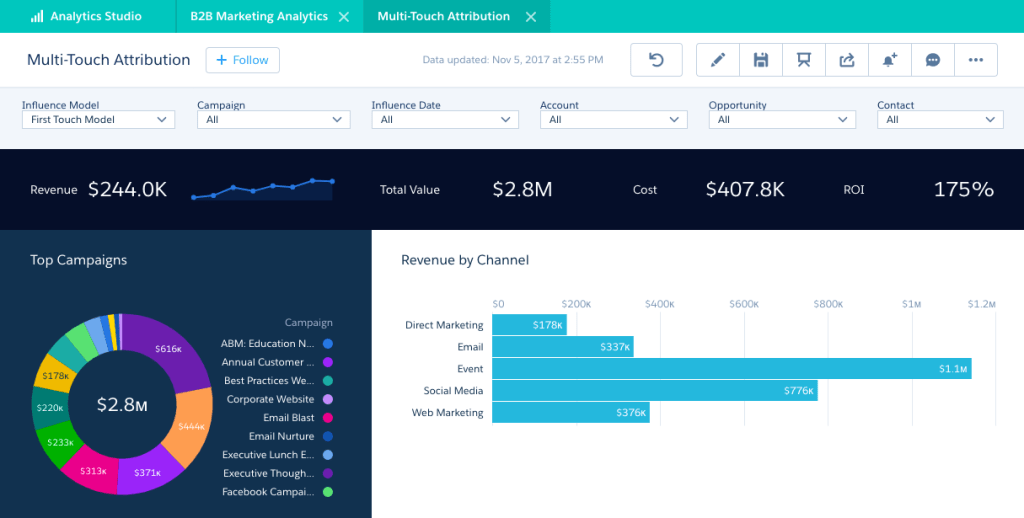
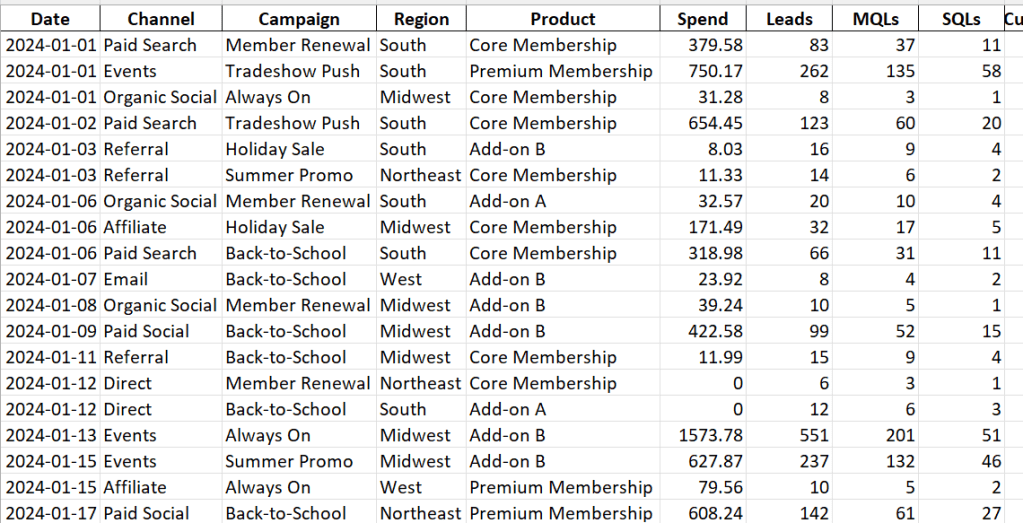
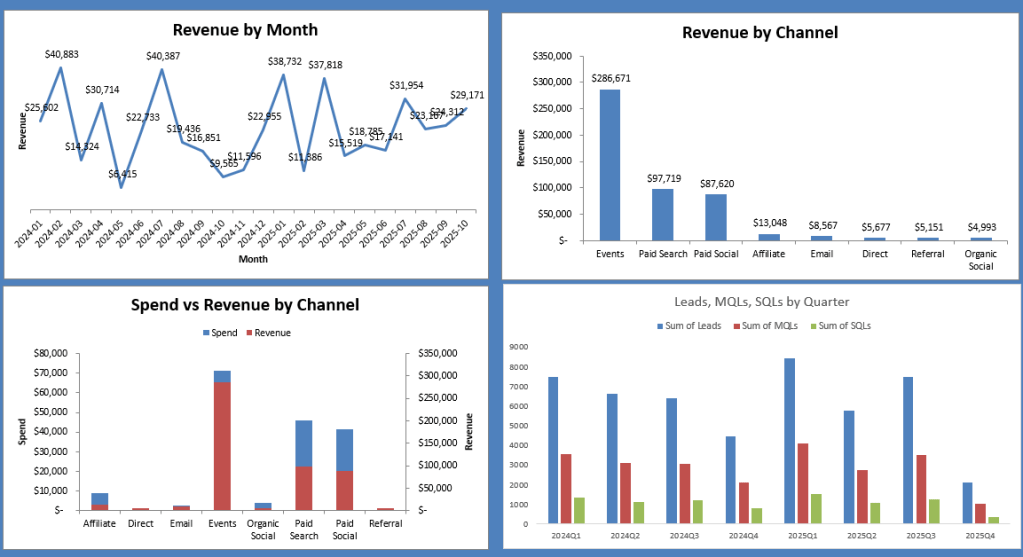
The following dashboard was designed to be adjusted based on the influence model and desired view — first touch, last touch, W-shaped, U-shaped, and evenly distributed.
Multi-Touch Attribution Implementation Example
I’ve implemented various attribution models, including W-shaped and custom data-driven attribution models, in Salesforce, HubSpot, and Marketo, integrating UTM tracking and campaign tagging for measurement.
In one instance, by aligning lead source with opportunity stages, I was able to identify that paid search influenced 40% of pipeline, while email nurtures played a significant role in mid-funnel acceleration.
Leveraging these insights led to a 20% increase in pipeline efficiency by reallocating budget to high-performing touchpoints.
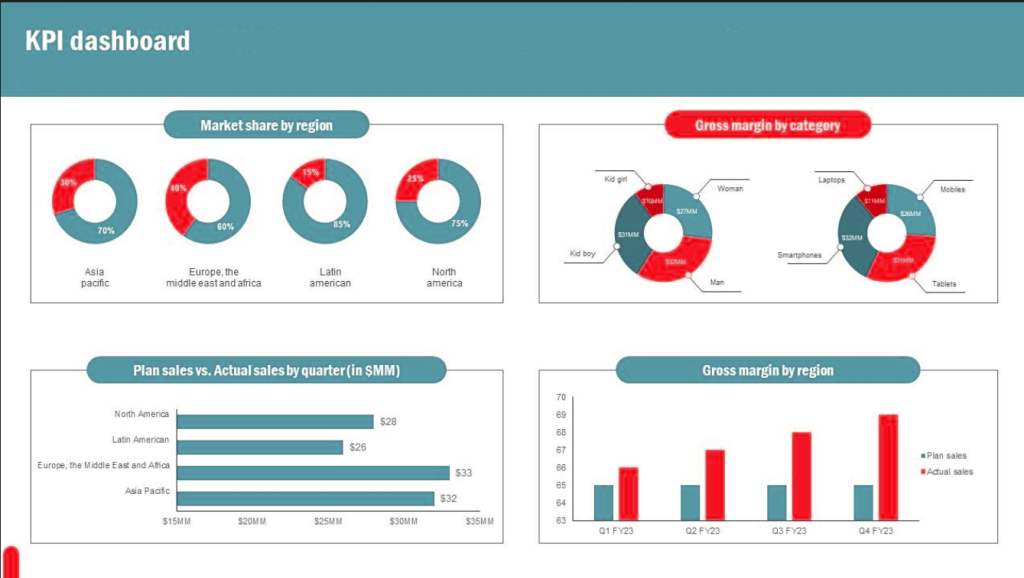
Data Exploration & Optimizing the Funnel Example
When exploring and auditing the marketing funnel in preparation for setting up a multi-touch attribution model, I found that the majority of content and lead generation was dedicated to the top of the funnel.
By simply repurposing content, adding new content, and devising new delivery methods that were directed towards filling gaps in the middle and bottom of funnel, my team was able to increase conversion rates and improve sales.
Building a well-rounded funnel, and using down-funnel tactics, increased conversion rates by 38%, and increased pipeline velocity by 23%.
Step-by-Step Approach for Setting Up a Multi-Touch Attribution Model
Setting up multi-touch attribution (MTA) for marketing pipelines requires designing a framework that assigns credit to each marketing touchpoint in the marketing funnel, or all actions that contribute to a conversion.
Building an MTA model is an excellent way for a marketing operations professional to gather key insights and gain an overall understanding of the marketing and business landscape, as it is a highly-involved process that, usually, encompasses auditing strategies and tactics, cross-functional collaboration and spearheading effective communication.
Define Objectives & Key Metrics
- Identify the business goals (understanding pipeline impact, optimizing budget allocation).
- Determine key metrics such as marketing-influenced pipeline, average order value (AOV), customer lifetime value (CLV), conversion rates, and customer acquisition cost (CAC).

Map the Funnel
- Map the funnel, which provides the opportunity to find gaps, overlaps and inefficiencies
- Establish a single source of truth to store and share the information
- Understand the customer journey, and/or identify the ICP
- Map the buyer journeys (or decision maker journeys for ABM)
- Assign numerical values to each touchpoint based on it’s location in the funnel, building in a time decay
Choose an Attribution Model
- First-touch: Gives full credit to the first interaction.
- Last-touch: Assigns all credit to the last interaction before conversion.
- Linear: Distributes credit equally across all touchpoints.
- Time decay: Gives more credit to interactions closer to conversion.
- U-Shaped (Position-based): Splits credit between the first and last touchpoint, with some weight to middle interactions.
- W-Shaped: Allocates credit across first touch, lead creation, and opportunity creation.
- Custom Data-driven: Uses machine learning to assign weights based on actual impact.

Data Cleanup
- Conduct initial database cleanup, and establish ongoing data hygiene practices.
- Create standard operating procedures and best practice documentation for teams to enter contact information and use the database (includes training).
Track & Integrate Data Sources
- Ensure accurate tracking and consistency across all platforms (CRM, marketing automation, web analytics), paying close attention to integrations and APIs.
- Use UTM parameters for tracking source, medium, and campaign across digital channels. Build reports that quantify these parameters.
- Integrate offline and online touchpoints (paid ads, emails, webinars, sales outreach).
- Communicate and collaborate with teams for clarity into strategies and tactics.

Implement Attribution in a CRM
- Leverage platforms like HubSpot, Marketo, Salesforce, to establish a “single source of truth” to house your MTA model.
- Use marketing automation workflows to capture lead interactions at every funnel stage.
- Set up custom reporting dashboards for attribution insights.
Analyze & Optimize Performance
- Validate and test, with ongoing maintenance and iteration.
- Regularly review MTA reports to understand which channels drive pipeline and revenue.
- Optimize spend by reallocating budget to the highest-performing touchpoints.
- Refine the model based on data trends, campaign impact, and customer journey insights.
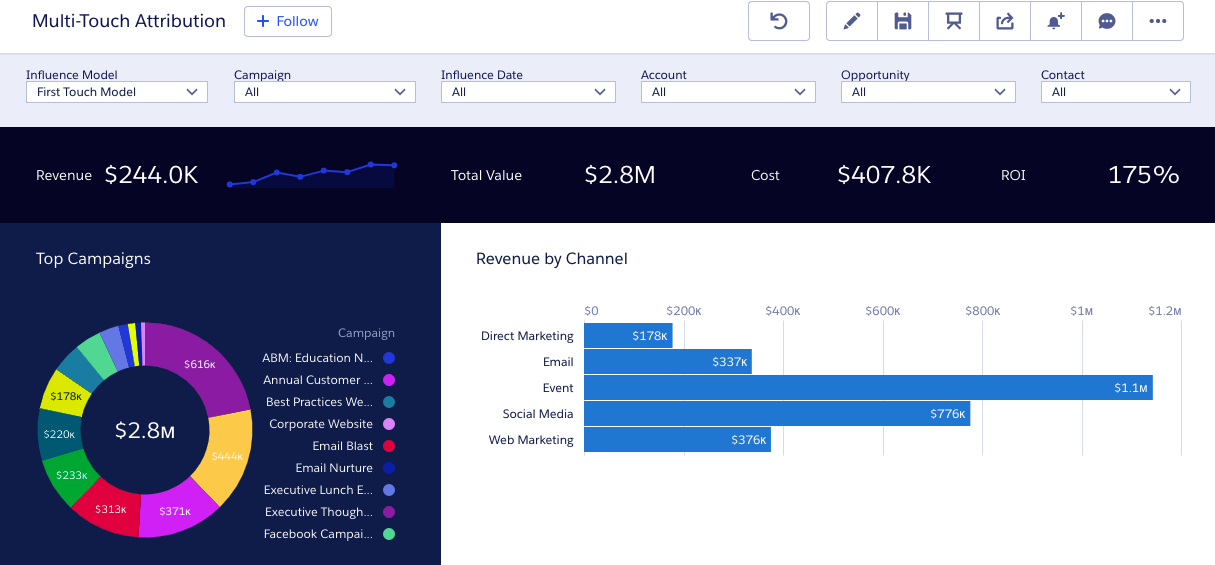
Visualize and Share Data
Build dashboards and reports for benchmarking and performance data including, for example, funnel velocity, customer acquisition cost, customer lifetime value, average order value, conversion rates.
Adjustable Multi-Touch Attribution Dashboard

Let’s connect!
Interested in learning more about my background, or scheduling a call? Let’s discuss how I can contribute to your organization!
Marketing Operations, Revenue Operations, AI Prompts, Graphic Design, Templates, and more