Data is power, and data analytics are a crucial aspect in any Marketing Operations role or team – whether working in B2B, ABM, B2C, DTC or E-commerce environments. I have expertise creating dashboards for high-level, “at-a-glance” data, as well as generating regular, in-depth reports providing channel and campaign insights.
I have developed automated dashboards using a variety of tools using Excel and Pivot Tables & Charts with Power Query, Google Analytics (GA4) and Looker Studio, Tableau, Power BI, and Domo, and more.
In each report, I include an Executive Summary, a brief introduction of valuable insights into the performance of digital efforts, followed by concise slides formatted with an outline of Insight > Data > Suggestion. Each presentation offers more information in “leave behind” or takeaway slides that dive deeper into the specific metrics.
High-level executive data summary & outline:
Insight
(example) Organic traffic is down considerably from previous year
Report
Snapshot of YoY web traffic showing organcic traffic changes.
Include takeaway of detailed YoY web traffic report with organic traffic sources
Suggestion
Provide strategic suggestions for improvements, like improving on-page and technical SEO, and building content funnels
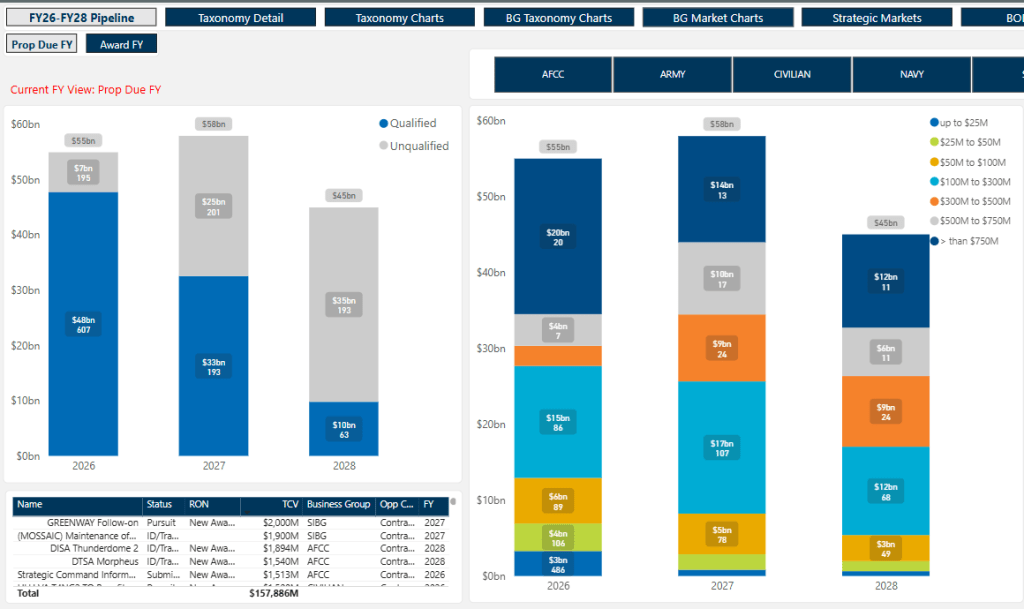
Power BI Pipeline Dashboards
Due to the nature of company and work, most of the information is redacted. These are solely included to provide some insight into my work.


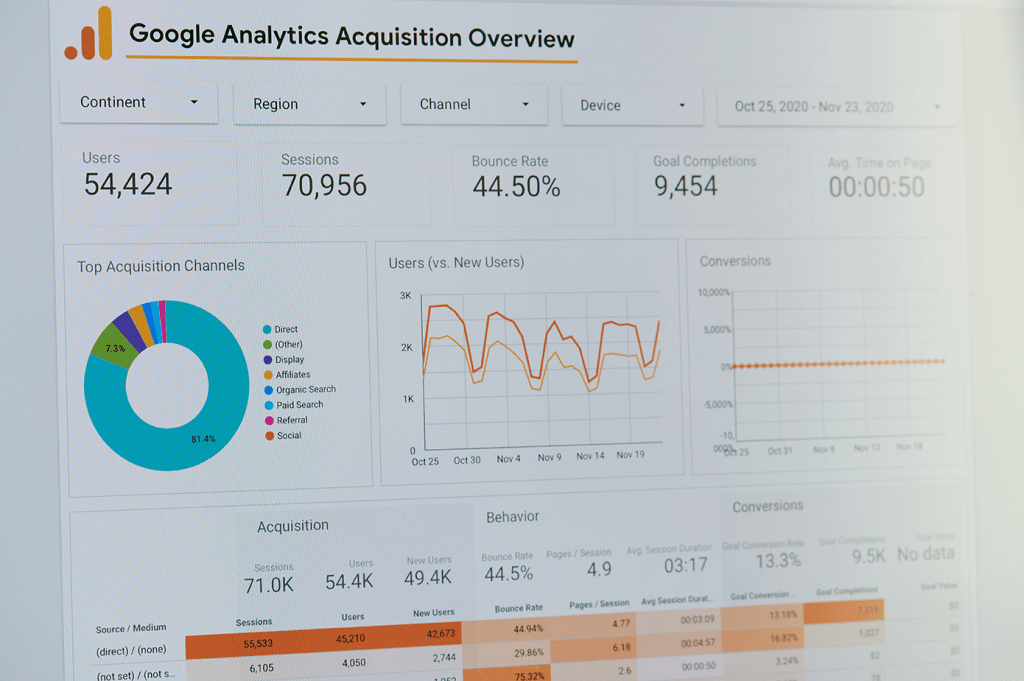
Looker Studio Dashboards
In the campaign performance report on the right, a clear insight is that there is considerable traffic coming from mobile (more than was expected) and therefore, we needed to ensure the website and landing pages were mobile optimized and user-friendly for all devices.
The full dashboard is real-time, interactive, with drill-down capabilities to examine each chart more fully.
PATH ANALYSIS: Real world example
Insight: There were clear patterns of “looping behavior” in website visitors. For instance, users would visit a product page, then go back home, then to a feature page, a blog post …. with no clear direction nor path. As expected, they were not converting through the funnel.
Hypothesis: visitors were not finding the info they were looking for quickly and easily enough, and leaving the site before taking next steps. Further, they were being delivered too much detailed information and losing sight of the higher goal.
Action: Combining A/B testing of hypothesis for UX issues, I conducted competitive analysis, behavior analysis, provided reports to stakeholders, and then collaborated cross-functionally with marketing, product, and developers/IT teams to update the website UX with a focus on persona-based funnels.
Steps included:
- Delve into behavior analysis and provide reports to stakeholders
- Conduct competitive analysis
- Build personas and identify ICPs
- Build prototypes and wireframes for new site design and strategies, using the illustrations to gain buy-in and communicate with teams
- A/B testing to confirm hypothesis
- Update website using persona-based funnels for clear pathways to conversion
Result: Increased conversion rates by 32% with increased average order value by 45% in 6 months
HubSpot Dashboards
Throughout my career, I’ve built automated dashboards in HubSpot providing a comprehensive overview of digital strategies, including monthly MQLs and funnel health.
Below are a variety of examples of HubSpot dashboards I created. For context, this was an email-heavy marketing team. It benefitted from updating segmentation and email strategies for optimized impact.
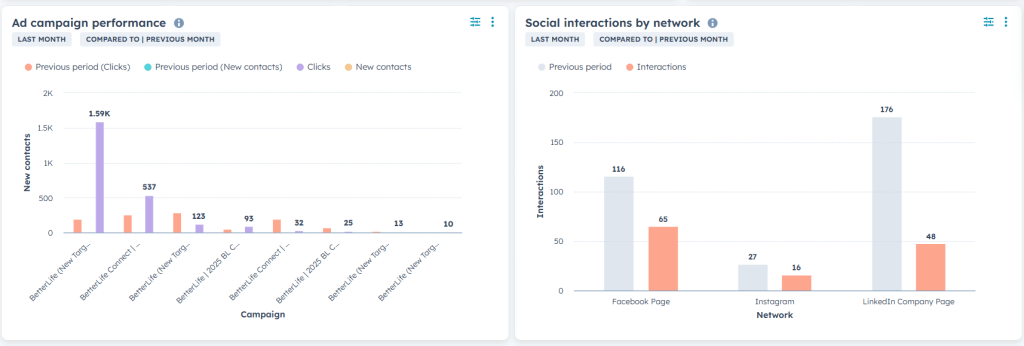
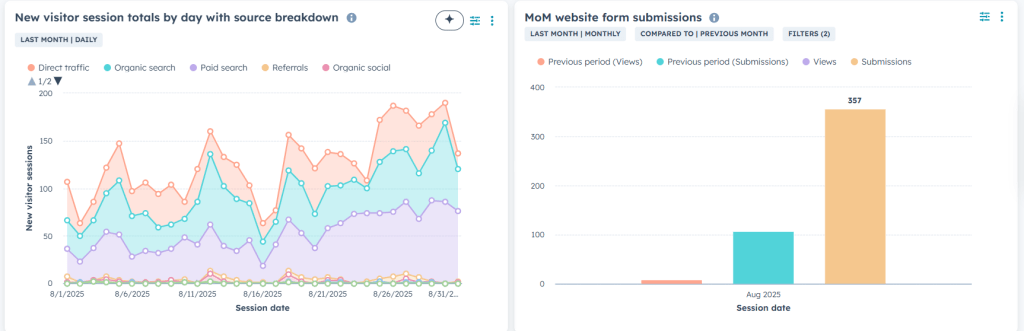
NOTE: These reports are from earlier in the process, and the decline in engagement helped me to devise segmentation and email strategies to improve conversion rates.
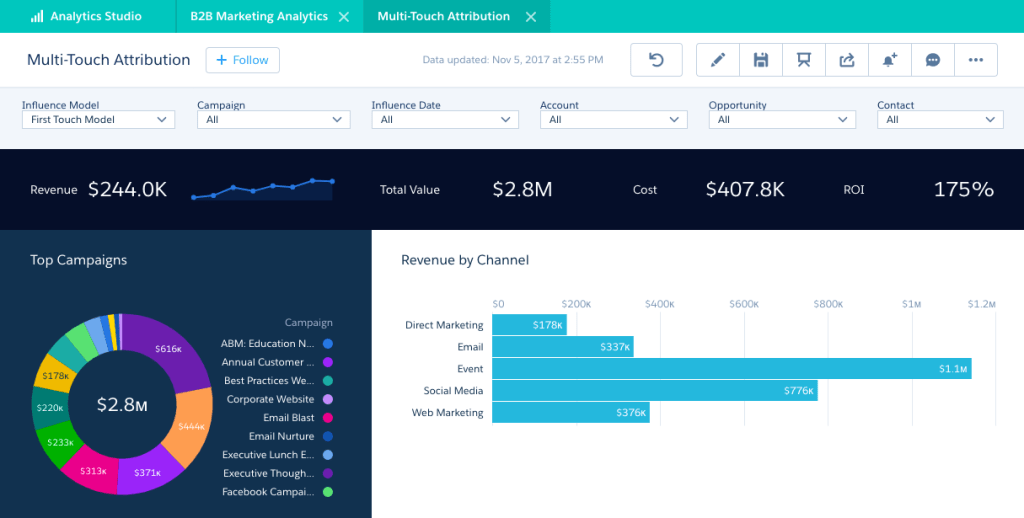
Additional Dashboard & Report Examples
Sadly, I lost a library of custom reports. The following dashboards are general reports I produced for the purpose of providing an overview and examples.
While these are images for the purpose of providing examples, the actual dashboards are dynamic, allowing users to drill down into each metric for a more detailed and in-depth analysis, while offering real-time data.


Let’s connect!
Interested in learning more about my background, or scheduling a call? Let’s discuss how I can contribute to your organization!